THE SOCIALIST REPUBLIC OF VIET NAM
Government News
Gov’t eyes higher socio-economic norms in 2011
VGP – The Vietnamese Government expects a higher economic growth rate and better social and environment indicators in 2011.
At the
opening session of the 8th sitting of the 12 Legislature this
morning, PM Nguyễn Tấn Dũng presented the Government’s report on socio-economic
situations in 2010 and tasks in 2011.
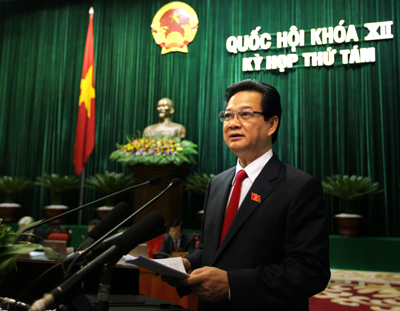
PM Nguyễn
Tấn Dũng addresses the opening session of the 8th sitting of the 12th
Legislature, Hà Nội, October 20, 2010 – Photo: VGP/Nhật Bắc
In 2010,
to cope with unfortunate economic and financial changes in the world, the
Government issued several resolutions and specific measures to stabilize
macro-economy, keep inflation in control and maintain a fairly high economic
growth rate.
So
far, Việt
Six solutions for
stronger socio-economic development in 2011
Mentioning socio-economic goals and
tasks next year, the PM underlined the overall target stronger macro-economic
stability and higher economic growth rate.
The
Government put forth six major solutions, namely (i) securing
macro-economic stability and major economic indicators; (ii) Further improving
investment environment and efficiency, promoting production, business activities
and economic restructuring; (iii) Safeguarding social security and welfare; (iv)
Boosting scientific and technological applications and environment protection
in order to better the quality of growth; (v) Sharpening the State management
while promoting administrative reforms, anti-corruption and anti-prodigality; and
(vi) Enhancing national defense and security, and diplomatic work.
The Government chief called for sectors, agencies and local authorities to
promptly put into reality these solutions after the NA’s approval.
He also asked the legislative body, mass organizations and people
throughout the country to join actions and efforts in realizing the goals in
2011, the first year to implement the five-year development plan 2011-2015.
|
2010 |
2011 |
|
Economic
indicators |
|
|
- GDP growth rate: 6.7% - Per capita GDP: US
$1,160 - Development
investment capital: up 12.9% against 2009 and equivalent to
41% of GDP -
State budget disbursement: 70% (by late
September) -
Newly-established enterprises: 85,000 people-run
ones, with the registered capital of VND 500 trillion, up 125% against 2009 -
State budget collection: 12.7% higher than the estimate and 17.6% higher than
2009 - Budget
overspending: below 6% (estimate: 6.2%) -
Total means of payment: up 20%, credit balance:
up 25%; bad debt: below 3% -
Total export turnover: up 19.1%, tripling the plan -
Total import turnover: up 16.5% -
Excess of imports over exports: US $13.5 billion, lower than 2009 - CPI increase: 8% (estimate: 7%) |
- GDP
growth rate: 7-7.5% against 2010 - Per
capita GDP: US $1,300 -
Total development investment capital: 40% of GDP -
State budget collection: VND 590.5 trillion -
State budget spending: VND 725.6 trillion -
Budget overspending: 5.5% of GDP - Total
export turnover: US $74.8 billion, up 10% against 2010 -
Excess of imports over exports: below 20% - CPI
increase: 7%
|
|
Social indicators |
|
|
- Job
generation: 1.6 million new jobs - Vocational
training: over 1.7 million people, including 430,000 farmers - Poor households: down by 1.85%. - Communes of health care standards: 80% - Internet-connected secondary schools: 100% - Junior secondary education
universalization: 100% provinces - Newly-established science and
technology enterprises: 300, doubling the 2009 figure - Vietnamese scientists generate over 30 new crop varieties of high yield and quality |
- New
enrollment to universities: up 6.5%; high schools: up 10%; vocational schools:
up 16.5% -
Birth rate reduction: 0.2‰ - Job
generation: 1.6 million laborers, including 87,000 guest workers -
Poor household: down by 2% -
Malnutrition rate in under-5-year-old children: down to 17.3% -
Patient bed/10,000 people: 21 - Urban
housing area per capita: 19 m2 |
|
Environmental indicators |
|
|
- Rural
population access to hygienic water: 83% - Urban
population access to clean water: 76% -
Forest coverage: 39.5% |
- Rural
population access to hygienic water: 86% - Urban
population access to clean water: 78% - Treatment
of medical solid waste: 82% -
Industrial parks and export processing zones with standard concentrated
sewage treatment systems: 55% - Collection
of solid waste in urban areas: 83% -
Forest coverage: 40% |