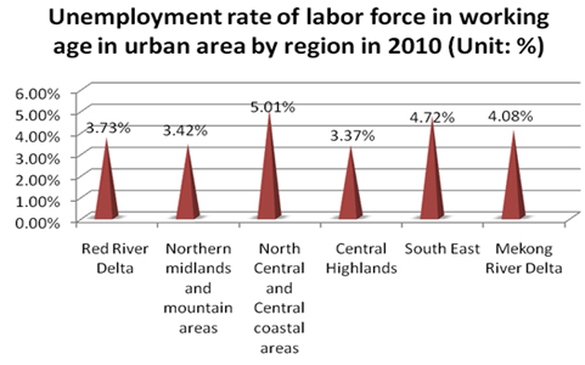
Unemployment rate by region in 2005-2010
19/11/2013 15:29VGP – Unemployment rate by region dropped gradually in every region over the five-year period.
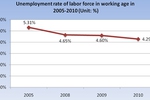
Unemployment rate in 2005-2010 period
VGP – The unemployment rate of labor force in working age declined constantly in the 2005-2010 period from 5.31% to 4.29%.
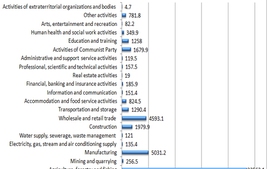
Employed population by kinds of economic activity
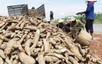
Population 11/11/2013 14:05VGP – In 2005-2010, three sectors of agriculture, forestry and fishing; manufacturing; and whole sale and retail trade recruited the largest number of employed population.
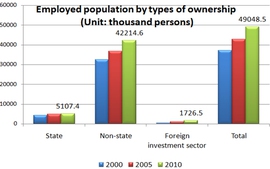
Employed population by types of ownership
Population 11/11/2013 13:28VGP – In the 2005-2010 period, non-state ownership employed the biggest number of working-age population. The employed population reached nearly 50 million in 2010.
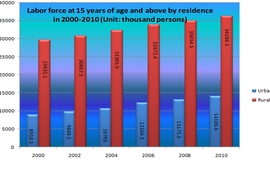
Labor force at 15 years of age and above
Population 25/10/2013 08:20VGP – The number of labor force at 15 years of age and above increased from over 38 million in 2000 to 50 million in 2010. Meanwhile, male and rural residents were higher than female and urban ones.
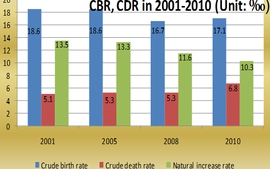
CBR and CDR in 2000-2010
Population 25/10/2013 07:10VGP – The crude birth rate was down from 18.6‰ in 2001 to 17.1‰ in 2010. Meanwhile, the natural increase rate declined to 10.3‰ from 13.5‰ in 2001.
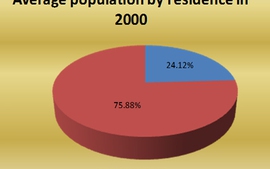
How average population by residence changes in 2000-2010
Population 02/10/2013 09:05VGP - The percentage of population living in urban areas increased to 30.50% in 2010 from 24.12% in 2000, according to official statistics.
Some indicators of population within 2000-2010
Population 26/09/2013 09:22VGP - Viet Nam's male population growth decreased from 1.34% in 2000 to 1.09% ten years later while the female figure fell deeper from 1.36% to 1.02%.
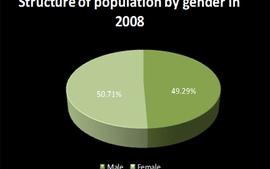
Structure of population by gender from 2000-2010
Population 26/09/2013 08:44VGP – The structure of Vietnamese population by gender was quite stable in the 2000-2010 period, according to the General Statistics Office.